Analyzing Congruence in Multimodal Music Representations
NYU Group Project · Deep Learning · 2026
A song can express emotion in many ways, through its sound, lyrics, and even its album cover. This project looks at how well these different forms of expression line up in multimodal AI models. My main contribution focuses on cross-modal similarity and retrieval, along with some of the initial data processing.
Emotion categories and data
Our dataset contained 150 songs, with an audio recording, album cover, and lyrics for each. The emotion labels followed the team’s adaptation of Russell’s valence-arousal framework: valence describes how pleasant or unpleasant an emotion feels, while arousal describes its energy or activation. The six groups below were chosen to cover different parts of that space, with 25 tracks in each and 24 subcategories overall.
| Emotion category | Valence | Arousal | Tracks |
|---|---|---|---|
| Vital & Joyful | +0.85 | +0.85 | 25 |
| Tender & Intimacy | +0.70 | -0.70 | 25 |
| Awe, Beauty & Transcendence | +0.90 | +0.10 | 25 |
| Tension, Threat & Aggression | -0.80 | +0.80 | 25 |
| Sadness, Loss & Lament | -0.75 | -0.75 | 25 |
| Dreaminess, Curiosity & Ambiguity | 0.00 | 0.00 | 25 |
These coordinates were category anchors assigned for the study, not emotion ratings collected from listeners. The categories and anchors are documented in the project’s data overview; track information is listed in the dataset manifest.
My role
My main contribution was the cross-modal similarity and retrieval analysis, along with some initial data processing. Our team worked with 150 songs, each paired with its album cover and lyrics, across six emotion categories.
Using the embeddings extracted by the team, I compared each recording with its cover and lyrics in ImageBind’s shared space. The next question was whether those similarities were useful for finding a match: given a recording, could the model pick out its cover or lyrics from the other tracks?
My notebook brings together per-track similarity scores, comparisons between emotion categories, and retrieval tests. It also compares ImageBind with specialist models; those technical details are available in the notebook.
Results and analysis
The main question was whether recordings, covers, and lyrics associated with the same emotions also aligned in the models’ representations.
Cross-modal retrieval
Audio-to-image retrieval found the correct cover first for 13 of 150 tracks (8.7%). That is about 13 times the 0.67% chance baseline, though most first guesses were still wrong. The correct cover appeared in the top ten for 34% of tracks. Matching recordings with lyrics was harder in both directions.
| Query → target | Recall@1 | Recall@5 | Recall@10 |
|---|---|---|---|
| Audio → image | 8.7% | 20.7% | 34.0% |
| Image → audio | 6.7% | 20.7% | 32.7% |
| Audio → lyrics | 4.0% | 10.7% | 14.7% |
| Lyrics → audio | 1.3% | 10.7% | 17.3% |
| Chance | 0.67% | 3.33% | 6.67% |
So there was a useful connection between the modalities, especially sound and covers. The retrieval scores alone could not tell us what that connection was based on.
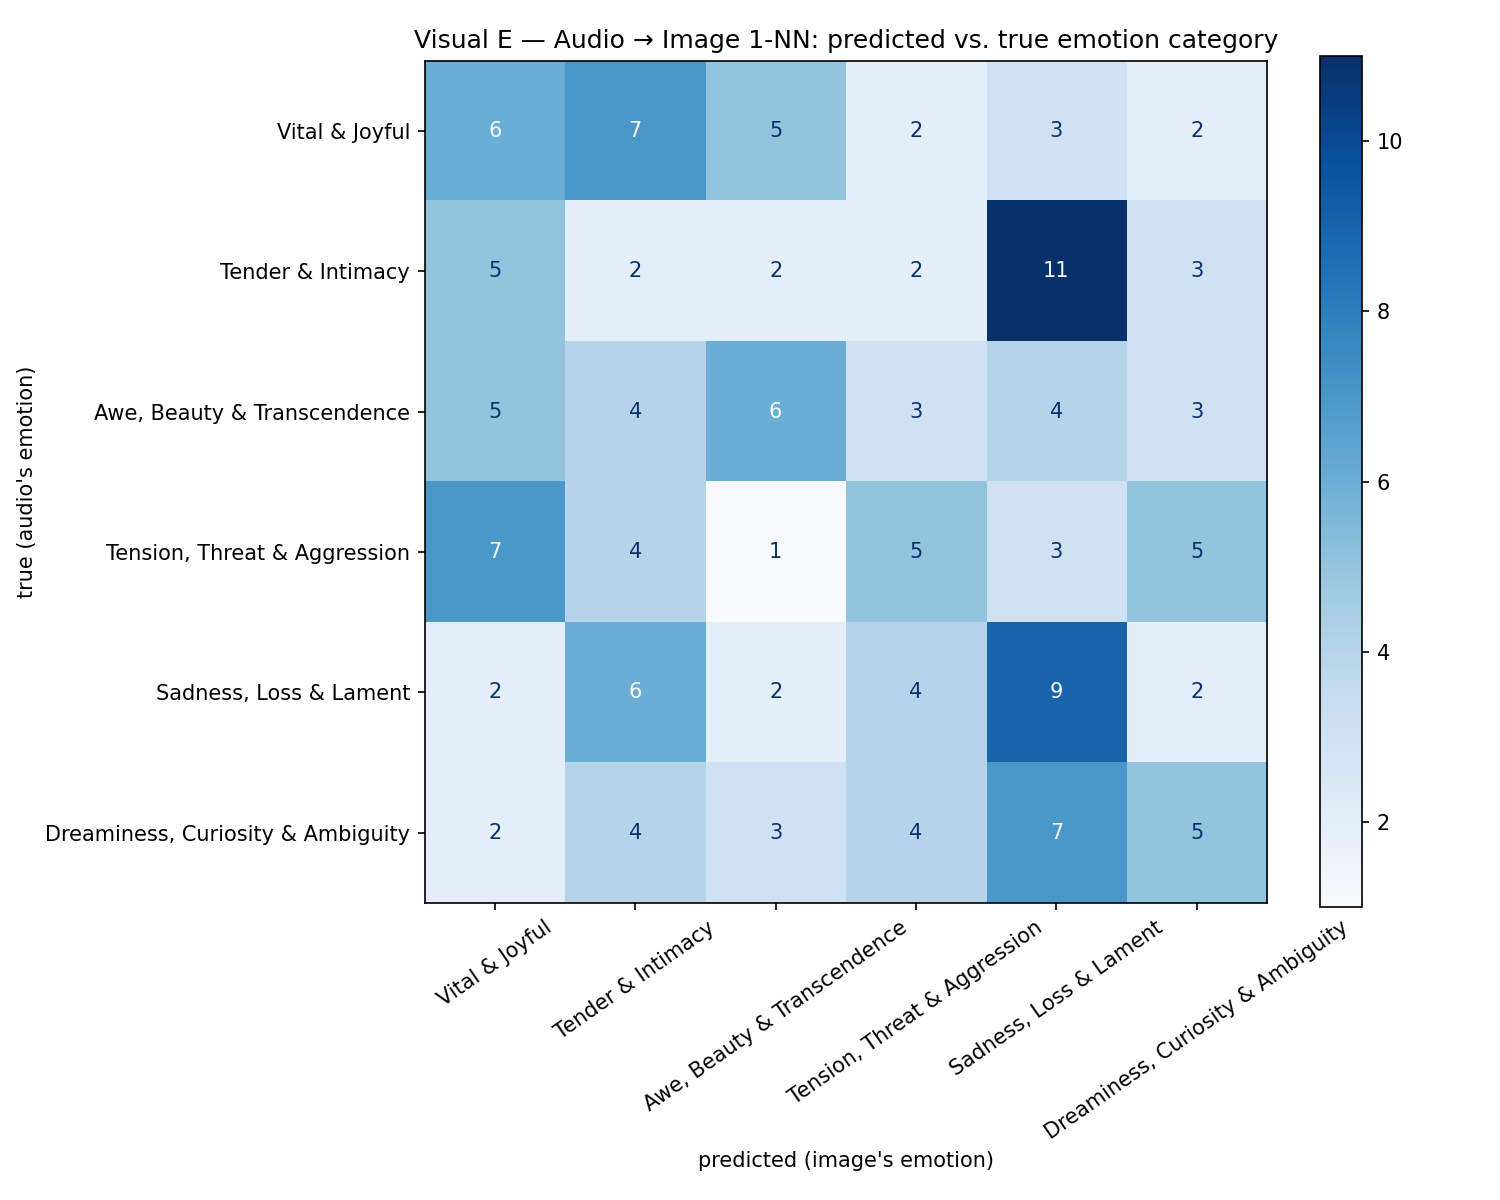
The emotion confusion matrix asks a related question: when an audio query retrieves a cover, does that cover belong to the same emotion category? Rows show the recording’s label and columns show the retrieved cover’s label. The diagonal totals 33 of 150 queries (22%), compared with a balanced-category baseline of about 16.7%. Off-diagonal counts are substantial, including 11 Tender & Intimacy queries retrieving Sadness, Loss & Lament covers. Emotion matching was therefore uneven, even where exact-track retrieval exceeded chance.
Emotional congruence
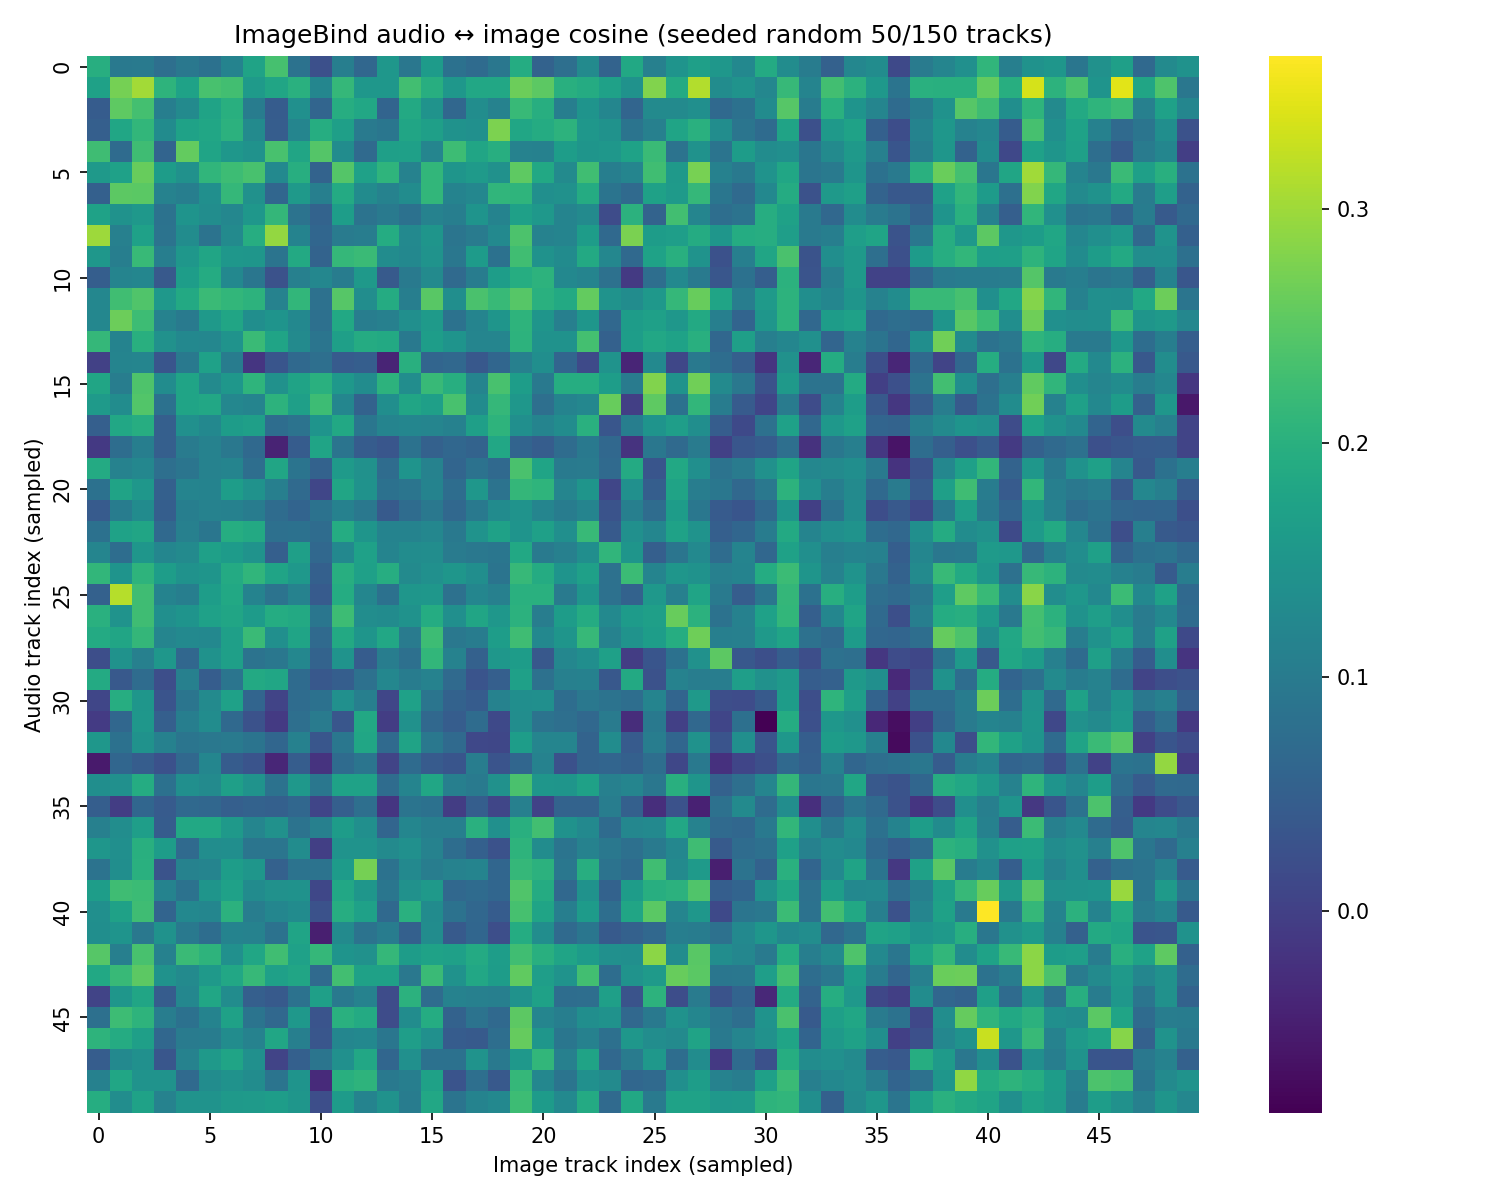
The mean similarity between audio and covers was 0.180, compared with 0.138 between audio and lyrics. Averaging the two gave a combined score of 0.159 (SD 0.051). These scores describe embedding similarity, not a percentage of emotional agreement.
The two comparisons were only modestly correlated across tracks (r ≈ 0.255). A song could match its cover quite well without matching its lyrics equally well. That was a reason to look at both scores rather than rely on their average. The heatmap shows audio-to-image similarities for a random sample of 50 tracks.
Differences between emotions
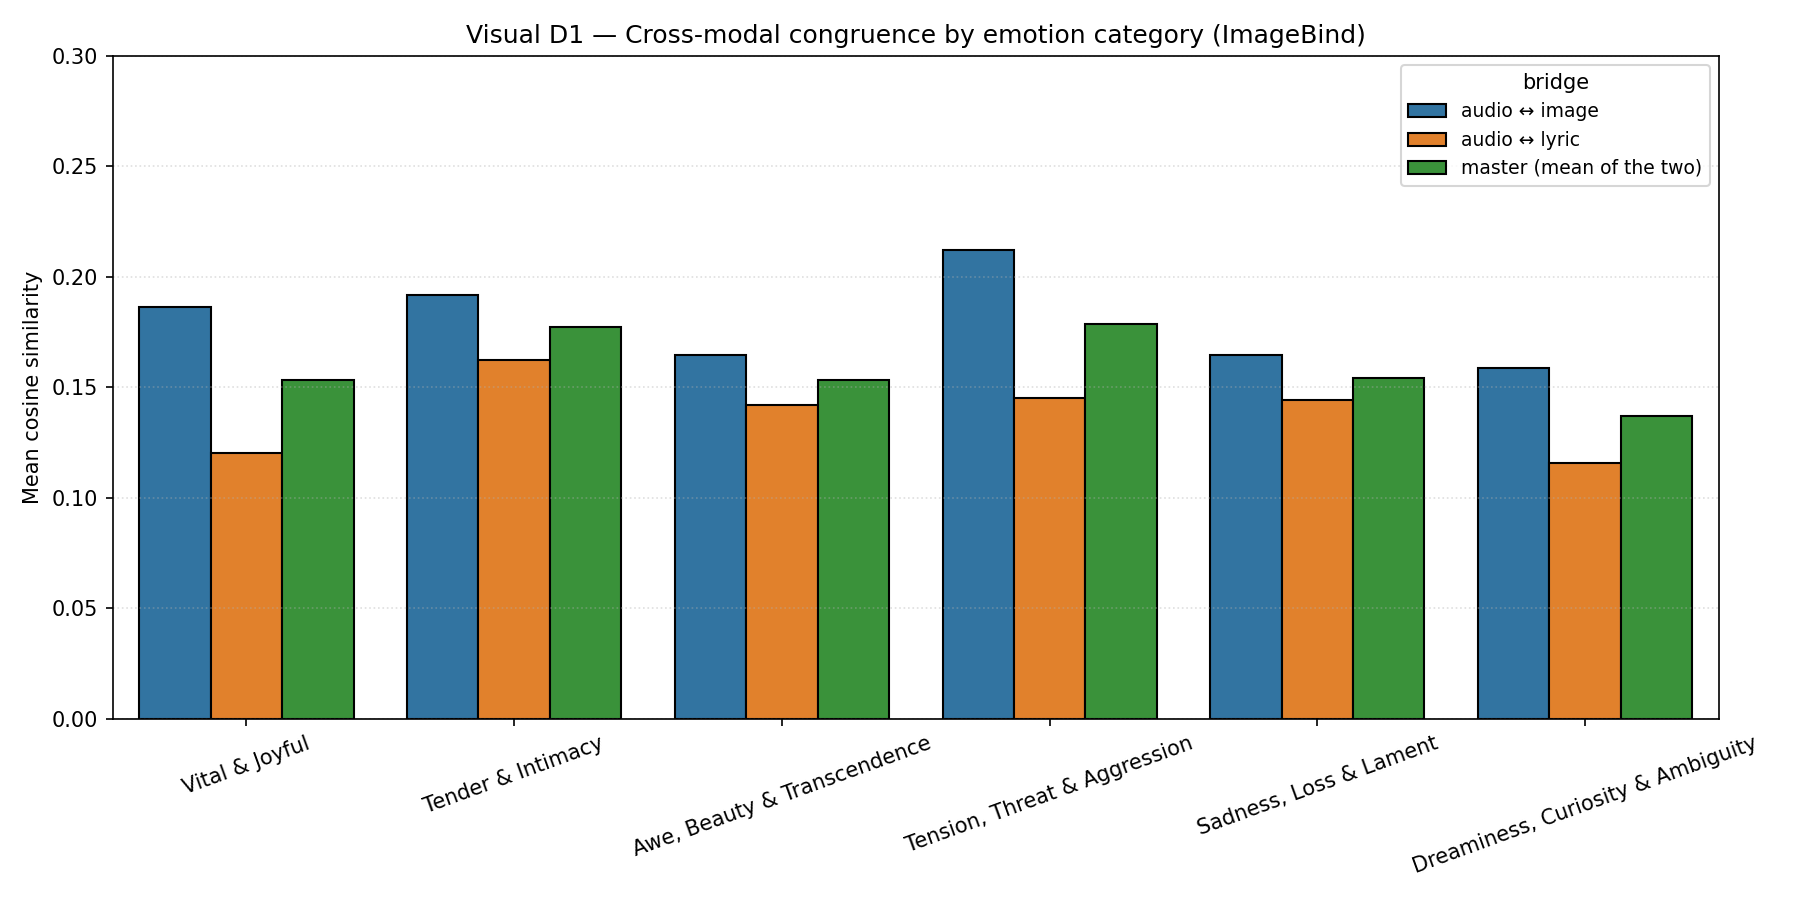
Tension, Threat & Aggression had the highest audio-to-image similarity, while Tender & Intimacy had the highest audio-to-lyric score. Dreaminess, Curiosity & Ambiguity had the lowest combined score.
| Emotion category | Audio / image | Audio / lyrics | Combined |
|---|---|---|---|
| Tension, Threat & Aggression | 0.212 | 0.145 | 0.179 |
| Tender & Intimacy | 0.192 | 0.162 | 0.177 |
| Sadness, Loss & Lament | 0.164 | 0.144 | 0.154 |
| Awe, Beauty & Transcendence | 0.164 | 0.142 | 0.153 |
| Vital & Joyful | 0.186 | 0.120 | 0.153 |
| Dreaminess, Curiosity & Ambiguity | 0.159 | 0.116 | 0.137 |
There were 25 tracks per category, with considerable variation inside each group. The combined-score standard deviations were around 0.05, comparable to the gap between the highest and lowest category means.
The 24 subcategories varied more widely: Angry / Aggressive scored about 0.199, while Curious / Intrigued scored 0.074. This suggests that some labels corresponded to clearer shared cues in the music, covers, and lyrics. It does not show whether those cues were emotional or stylistic.
Generalist and specialist models
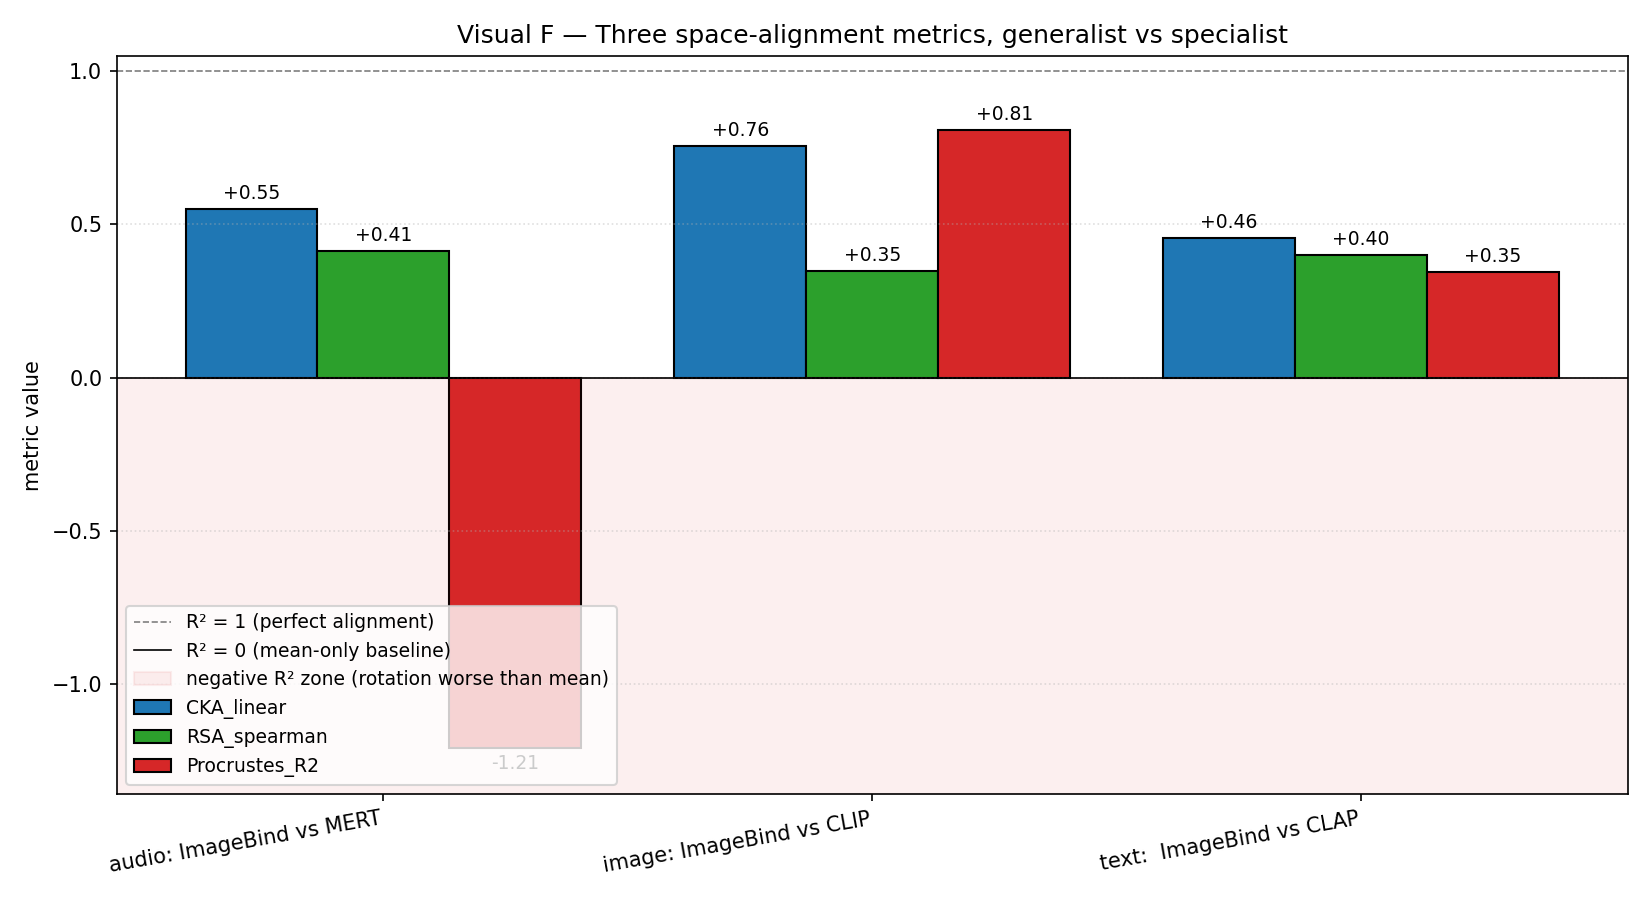
To check whether the findings depended on ImageBind, we compared its representations with MERT for audio, CLIP for covers, and CLAP for lyrics. ImageBind and CLIP showed the strongest agreement (CKA 0.756; Procrustes R² 0.807). Text showed partial agreement (CKA 0.456; R² 0.345), while audio had moderate similarity in its relationships between tracks but a poor geometric fit (CKA 0.551; R² -1.211).
The models therefore did not organize each modality in the same way. In particular, the audio results depended on which encoder was used. A poor alignment does not establish that either model is less capable at representing music.
Genre or emotion?
The UMAP grid shows one of the study’s main findings: points with the same emotion label do not form clear, separate groups. Instead, the colors are mixed across the visible clusters, in both ImageBind and the specialist models. The models found structure in the songs, but that structure did not closely follow our emotion categories. This agrees with the negative emotion silhouette scores discussed below. Each panel is a separate projection, so its position and orientation should not be compared directly with the others.
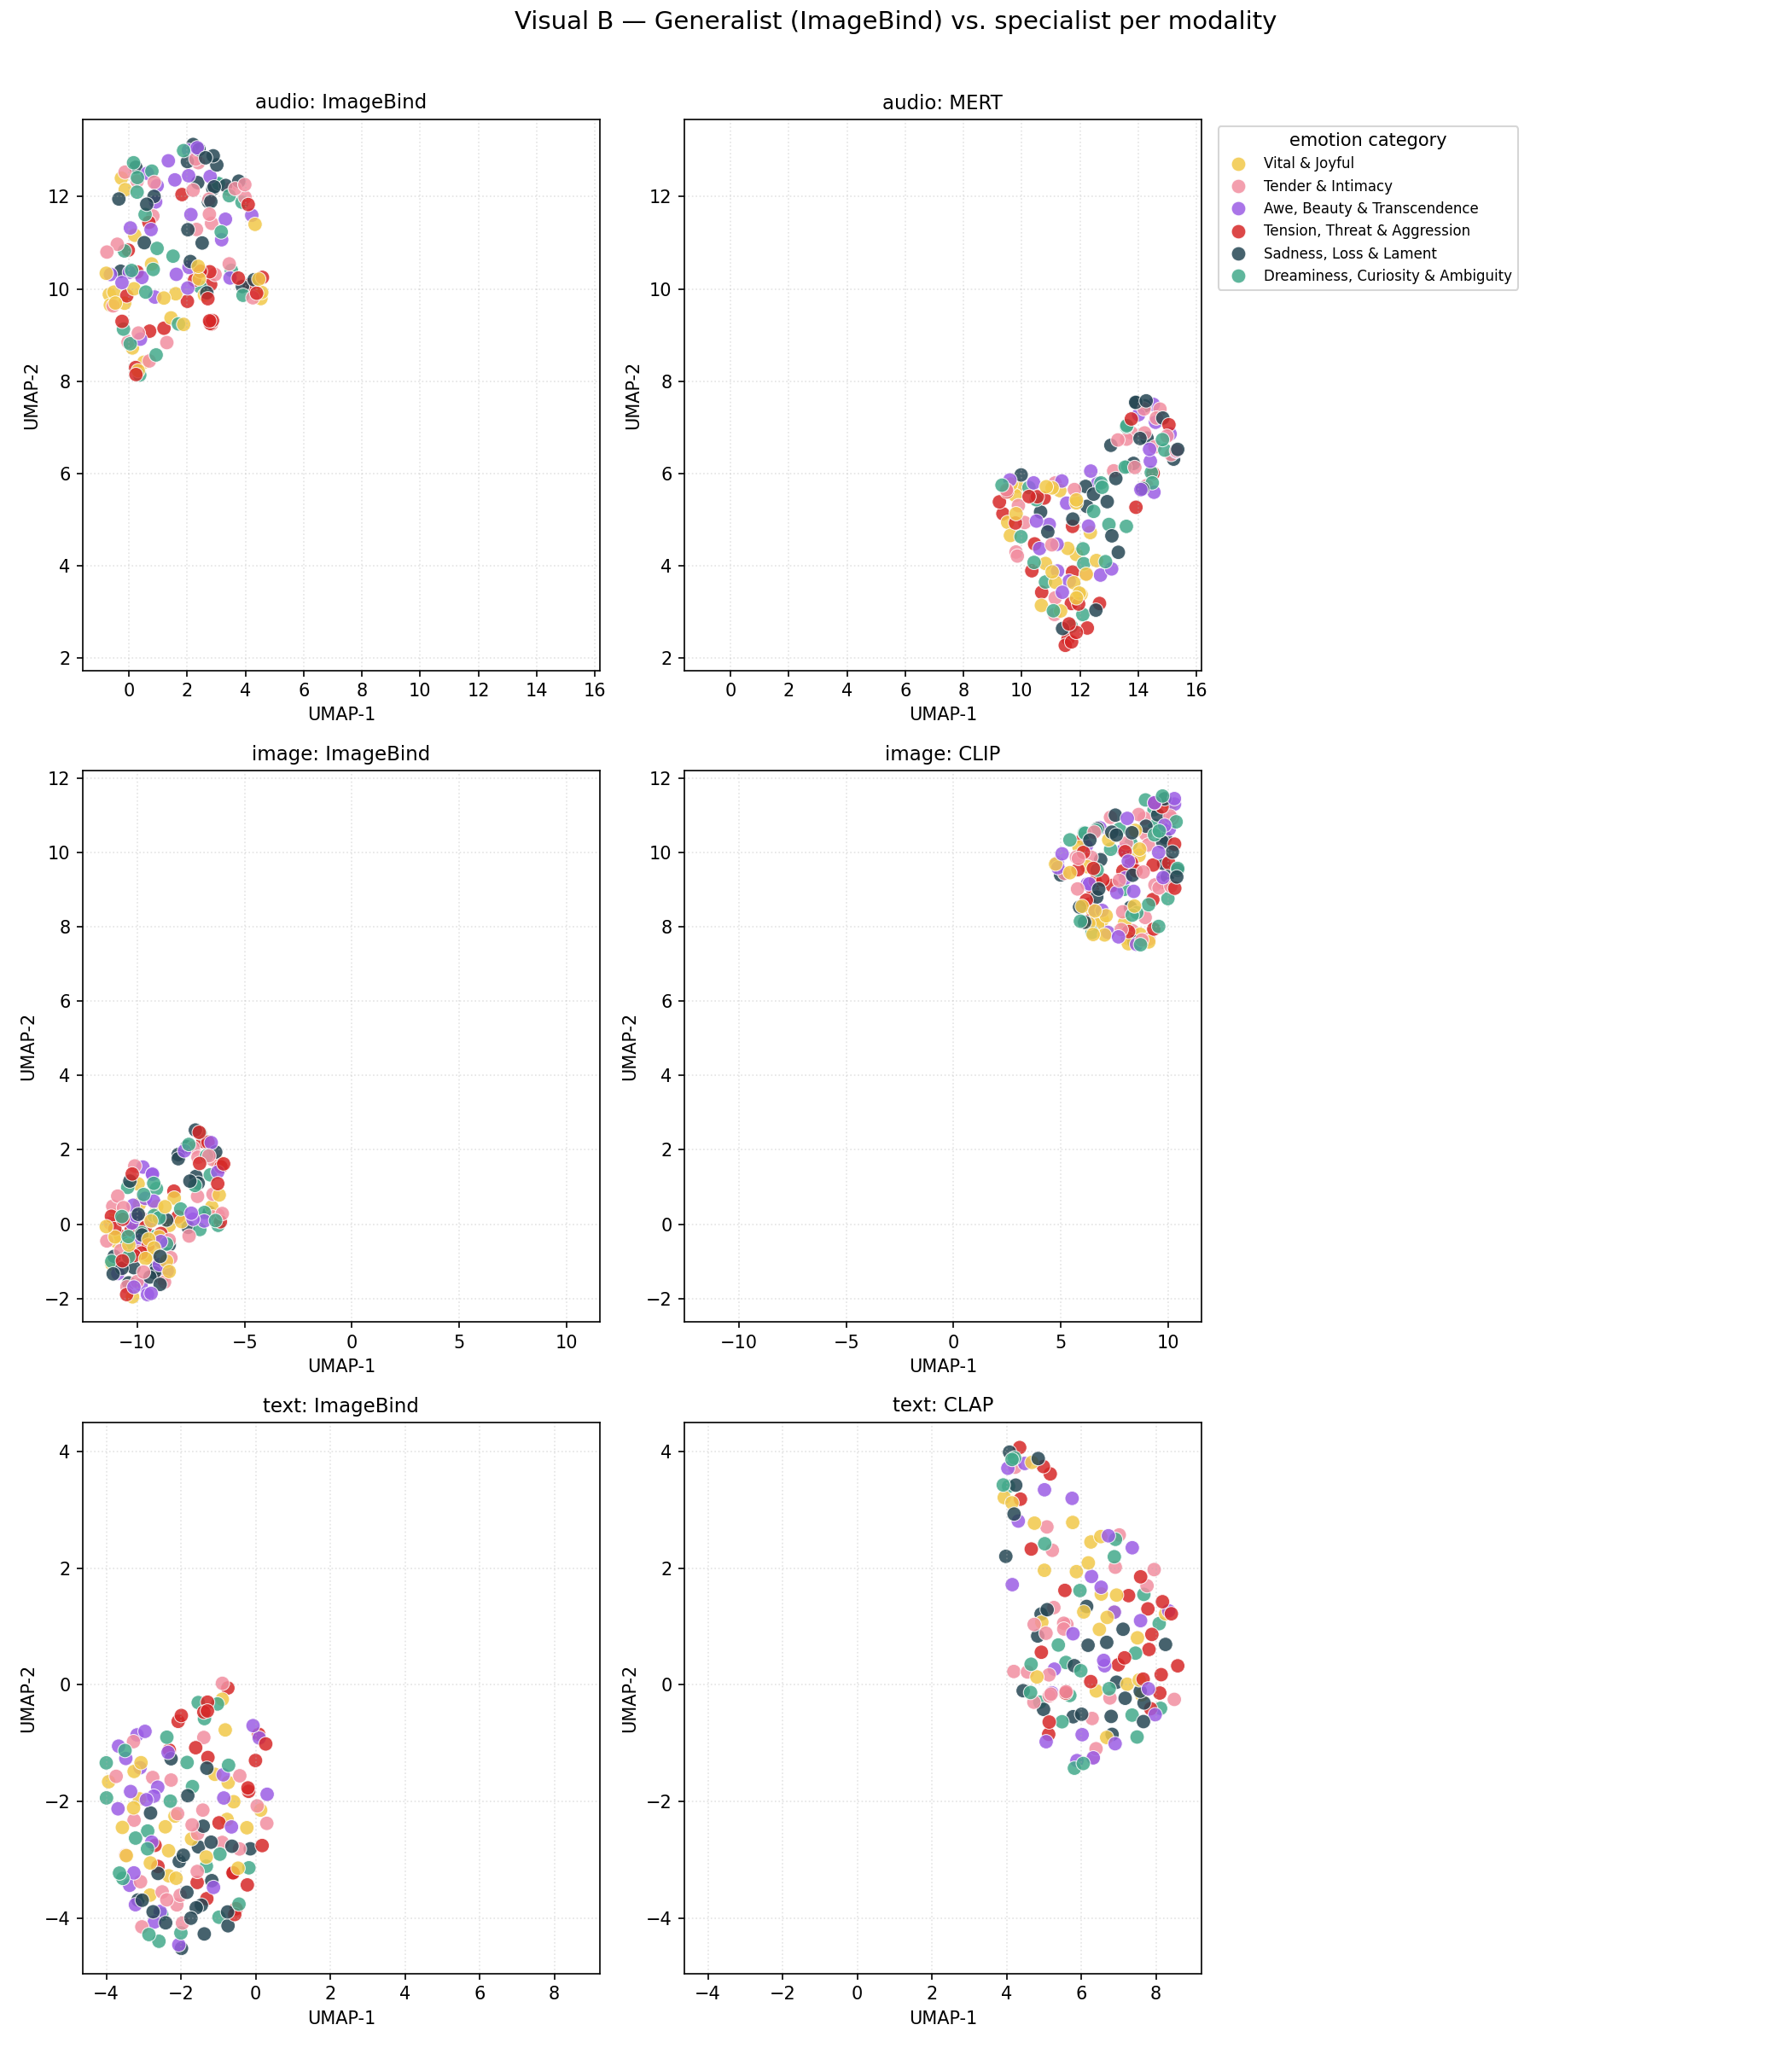
The later experiments made the emotional interpretation less clear. Emotion silhouette scores were negative in all 14 tested encoder spaces. Even the best, CLIP images at -0.026, did not show well-separated emotion clusters under that measure.
Comparing blocks in the similarity matrices also showed stronger grouping by genre than by emotion in nine of ten encoders, by roughly a factor of two. Some groups looked convincing in UMAP plots, but those plots alone were not enough to establish emotion clustering. Genre and emotion overlapped in our dataset, so a model could appear to capture one by picking up the other.
Audio and lyric sampling
Some encoders only receive a short audio window or a limited number of lyric tokens. The team tested different excerpts to see whether missing parts of a song contributed to the weak emotion grouping.
Using energy-peak audio windows raised ImageBind’s reported emotion-clustering purity score from 0.136 to 0.182. Using four lyric segments instead of the first 77 tokens raised CLAP’s score from 0.116 to 0.153. MERT and ImageBind text changed much less. Better input coverage helped the window-limited models, but did not resolve the difficulty of separating emotion from genre.
Valence and arousal
A regression probe then tested whether the embeddings could recover the valence and arousal anchors used to organize our emotion categories. All 14 tested spaces performed worse than predicting the target mean in leave-one-out evaluation; the best R² was -0.142.
This suggests that the assigned emotion positions were not captured reliably by the embeddings. Because the targets were fixed category anchors rather than listener ratings, the result applies to this labeling scheme, rather than every possible measure of musical emotion.
Discussion
Cross-modal matching worked above chance, especially between recordings and covers. The emotion-category comparisons showed some differences, but genre was more clearly separated. Changing the encoder or the input excerpt also changed the results, while the valence-arousal probe remained unsuccessful. Together, these findings suggest that the models captured shared cues across sound, covers, and lyrics without consistently organizing songs by the emotions assigned in our dataset.